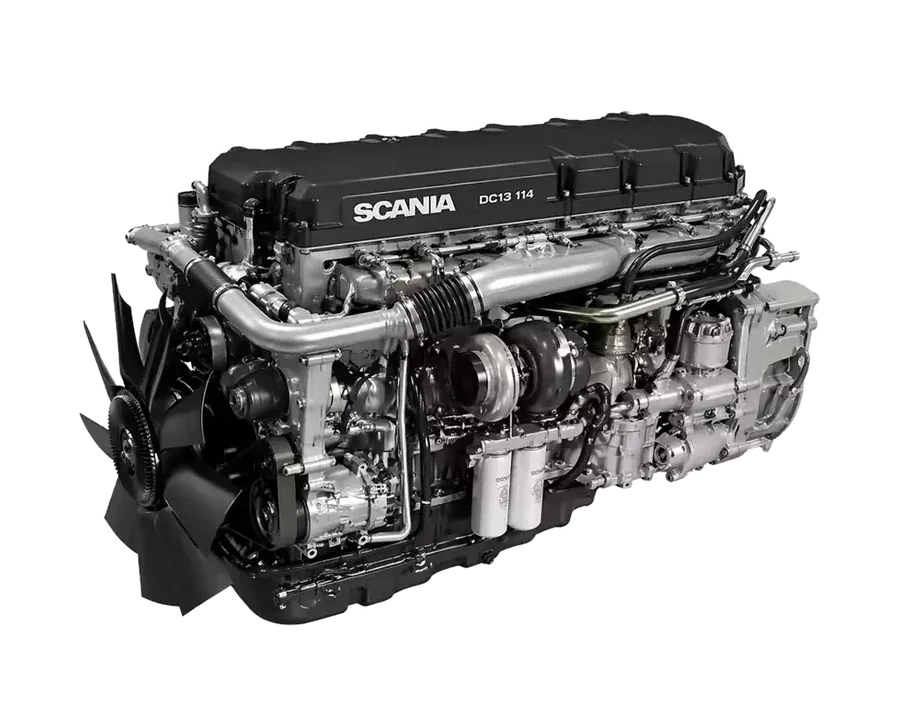
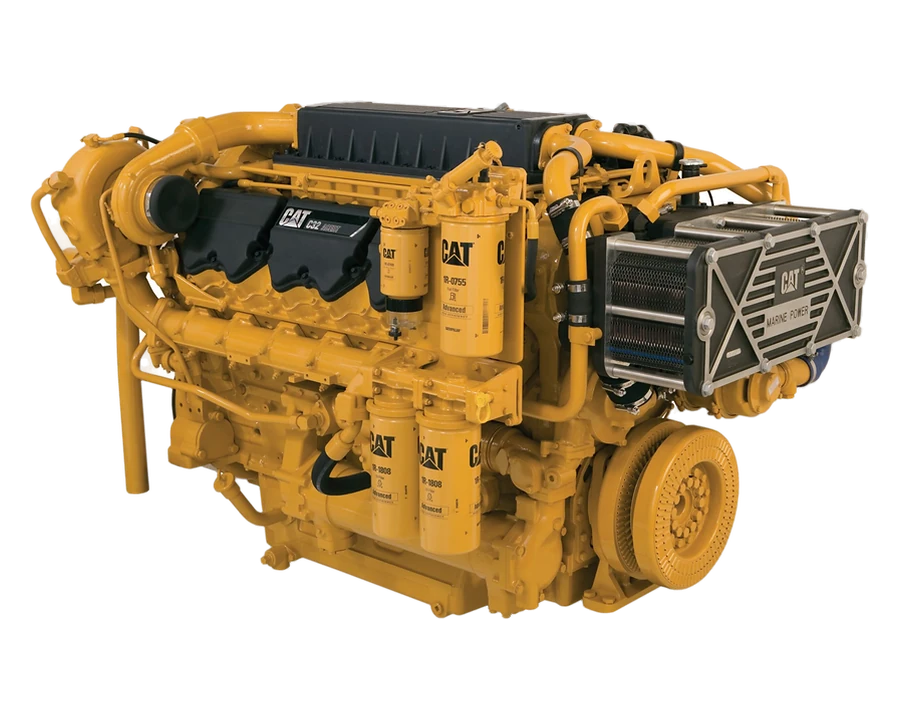
Illustration · the two engines were measured on engine test benches
March 2026, CNAS L23122 accredited and ILAC-MRA recognised laboratory. The findings come first, in brief; the method, then every measured value, follow.
Specific fuel consumption, road and marine−15.2% · −15.0%
Incomplete-combustion products, both benches−44.8% to −81.7%
Fuel after treatment, laboratory conclusionNo measurable change in standard parameters
In brief
15% less fuel per kilowatt-hour, with no measurable change in the fuel's standard parameters.
Two engines measured by an accredited laboratory, one road and one marine diesel, each on its own regulatory test cycle, four campaigns on each. Four findings carry the rest of this page.
−15.2% · −15.0%
Less fuel per kilowatt-hour, more power at every load point.
Fuel weighed, not metered: two runs of at least 2 h on the road engine, of at least 48 h on the marine engine, for each condition. Expanded uncertainty ± 2.0% per reading. Power +17.5% and +18.0% on average, as the laboratory prints it, ± 1.5%.
The products of incomplete combustion fall the furthest.
Carbon monoxide, hydrocarbons, particulates and smoke, against −20.0% for nitrogen oxides and −15.0% for carbon dioxide. Weighted over the ESC and E3 cycles, three samplings per condition.
The fuel's standard parameters do not measurably change. Its ignition quality does.
Eleven comparative analyses before and after treatment (appendix C.3). The reports give the laboratory's conclusion, not the individual values: no measurable change in standard physicochemical parameters, within the detection limits of the methods. Cetane number 52 → 56 on the road diesel, ISO 5165.
Where an uncertainty is stated, every change sits well outside it; both cross-checks hold.
± 2.0% on consumption, ± 3.0% on nitrogen oxides, ± 8.0% on particulates, on each reading, against changes of 15%, 20% and 69%. Coverage factor k = 2, approximately 95% confidence. No uncertainty is stated for the smoke number, nor for NO and NO₂ separately. Power recomputed from torque and speed agrees within 1.1 kW; sulphur oxides match the sulphur burnt.
Source Test reports GBT104002131 (Scania) and GBT104002132 (Caterpillar), March 2026. The marks shown are the laboratory's, as printed on the cover of both reports.
Reader's guide
Eight questions an engineer asks, answered in order.
Each question leads to the section that answers it. Every bench figure comes from the two laboratory reports; where the page adds a calculation or a company statement, it says so.
01
Who measured, on what, and how?
A CNAS L23122 accredited laboratory; a 265 kW road engine and an 890 kW marine engine; two campaigns without and two with the catalyst on each.
Not measurably in its standard parameters: that is the laboratory's conclusion on eleven analyses before and after. Its ignition does change: cetane number 52 → 56 on the road diesel.
Yes. Power recomputed from torque and speed agrees within 1.1 kW at eight load points, sixteen values; sulphur oxides measured at 8.46 and 7.19 g/kWh, against 8.45 and 7.19 expected from the fuel burnt.
Two engines, each traced to its serial number and catalyst batch.
Each bench result on this page belongs to one identified engine, one fuel batch and one catalyst batch.
GBT104002131
Scania DC13-114
Heavy-duty road diesel
Rated power
265 kW at 1,900 min⁻¹
Maximum torque
2,200 Nm at 1,000–1,300 min⁻¹
Architecture
6 cylinders in line · 12.7 L
Air and after-treatment
Turbocharged, intercooled · EGR
Emission class
Euro V · China V
Serial number · year
6 583 247 · 2009
Manufacturer · idle
Scania CV AB · 430 min⁻¹
Fuel
EN 590 / GB 19147
Cycle
ESC, 13 modes · 2005/78/EC
Duration per campaign
at least 2 h continuous
Catalyst batch
NTX-QC-2024-0038
Test period
20–26 March 2026
Test cell
24.0 °C · 53% RH · 1013.8 hPa · natural ventilation, no air conditioning
GBT104002132
Caterpillar C32 ACERT
Marine propulsion diesel
Rated power
890 kW at 1,800 min⁻¹
Maximum torque
5,400 Nm at 1,200 min⁻¹
Architecture
12 cylinders in V · 32.1 L
Air
Twin-turbocharged, aftercooled
Emission class
IMO Tier II
Serial number · year
TGH01247 · 2016
Manufacturer · idle
Caterpillar Inc. · 600 min⁻¹
Fuel
DMB · ISO 8217, 1.80% S
Cycle
E3 · ISO 8178-4
Duration per campaign
at least 48 h continuous
Catalyst batch
NTX-QC-2024-0042
Test period
16–26 March 2026
Test cell
24.2 °C · 53% RH · 1013.2 hPa · natural ventilation, no air conditioning
Source GBT104002131 §2.1, §3.1, §3.3, PDF p.7, 11, 12 · GBT104002132 §2.1, §3.1, §3.3, PDF p.7, 10, 11
02 · Protocol
Same engine, same fuel batch, same environmental conditions: by the laboratory's design, the catalyst is the only change.
Two campaigns without the catalyst, two with. Between them the circuit is drained, the lines flushed, and refilled with fresh fuel from the same batch.
01Baseline, campaign 1 — consumption and emission samplingwithout
02Baseline, campaign 2 — same measurements, repeatedwithout
03Circuit drained, lines flushed, fresh fuel from the same batch—
04Catalyst added to the fuel tank at 1 : 20,000with
05Stabilisation, 2 h at medium load, full circulationwith
06Catalyst, campaign 1 — same measurementswith
07Catalyst, campaign 2 — same measurements, repeatedwith
Source GBT104002131 appendix B.2, PDF p.20 · GBT104002132 appendix B.2, PDF p.18
The sequence cannot be alternated: once the catalyst is introduced, the same fuel batch does not return to its untreated state. The product is a clear liquid, fully miscible with diesel and marine diesel oil, added directly to the tank and mixed by the fuel circulation itself, with no pre-treatment or special equipment (appendix B.1 of the marine report). Reported consumption is the mean of two campaigns, emissions the weighted mean of three samplings. The report also states (section 2.5) that, prior to activation, engine performance and emissions were confirmed unaffected by the physical installation of the device.
Each cycle weighs its modes differently.
Emissions are not a plain average. Each operating mode carries a regulatory weight, and the result is the weighted mean over the whole cycle.
E3 · ISO 8178-4Caterpillar · 4 modes on the propeller law
100% power, 1,800 min⁻¹20%
75% power, 1,638 min⁻¹50%
50% power, 1,440 min⁻¹15%
25% power, 1,134 min⁻¹15%
Source GBT104002131 §3.4, PDF p.13 · GBT104002132 §3.4, PDF p.11
Show every mode as a table
ESC · Scania DC13 · section 3.4
Mode
Speed
min⁻¹
Load
Weight
Duration
1
Idle
430
0%
0.15
4 min
2
A
1,105
100%
0.08
2 min
3
B
1,430
50%
0.10
2 min
4
B
1,430
75%
0.10
2 min
5
A
1,105
50%
0.05
2 min
6
A
1,105
75%
0.05
2 min
7
A
1,105
25%
0.05
2 min
8
B
1,430
100%
0.09
2 min
9
B
1,430
25%
0.10
2 min
10
C
1,755
100%
0.08
2 min
11
C
1,755
25%
0.05
2 min
12
C
1,755
75%
0.05
2 min
13
C
1,755
50%
0.05
2 min
E3 · Caterpillar C32 · section 3.4
Mode
Rated speed
min⁻¹
Rated power
Weight
1
100%
1,800
100%
0.20
2
91%
1,638
75%
0.50
3
80%
1,440
50%
0.15
4
63%
1,134
25%
0.15
03 · Instruments
Fuel is weighed, not metered; every calibration due date fell after the test period.
Torque and power come from a water-brake dynamometer; each exhaust species has its own analyser method, listed below.
Exhaust gas
AVL AMA i60CO and CO₂ by non-dispersive infrared, NOx by chemiluminescence, hydrocarbons by flame ionisation, oxygen by paramagnetism
Sulphur oxides · marine
Horiba VS-3000UV fluorescence
Particulates
AVL SPC 472Gravimetric, ISO 8178-1
Smoke opacity
AVL 415SEPartial flow
Load bench
Schenck W700Water brake · strain-gauge torque transducer, ± 0.1% of full scale · acquisition at 10 Hz or more
Engine speed
Inductive pickup± 1 rpm, sent wirelessly to the control centre
Consumption
Sartorius Combics 3Gravimetric weighing, no flow meter
Cetane number
CFR engineWaukesha F-5 or equivalent, ISO 5165 · compression ratio continuously variable, ± 0.1 · injection delay read electronically, ± 0.1° · fuel at 40 ± 0.2 °C, room at 25 ± 2 °C · three measurements per sample
The instruments listed in section 2.4 of each report were calibrated to ISO/IEC 17025:2017, CNAS procedures and manufacturer specifications. Next due dates, all after the test period: CO, CO₂ and hydrocarbons 15 May 2026; NOx and oxygen 15 June; particulates 12 June; smoke 30 June; dynamometer 15 June; balance 5 June; speed 15 June; sulphur oxides 20 June. Ambient conditions were logged continuously, and testing suspended as soon as they left the band.
Source GBT104002131 §2.4, appendices D.3 and E.3, PDF p.7-8, 23, 25 · GBT104002132 §2.4, appendix E.3, PDF p.8, 23
Engine conditions during the test, as the reports give them.
Each report gives a single value or range per engine, not separate values for the baseline and treated runs.
During test
Scania DC13
Caterpillar C32
Coolant
85 ± 2 °C
85 ± 2 °C
Intake air
24.3 °C
25.1 °C
Charge air, after intercooler
45–50 °C
48–52 °C
Fuel at injection pump
36–40 °C
38–42 °C
Lubricating oil
90 ± 3 °C
92 ± 3 °C
Boost pressure, absolute
210–230 kPa · rated, full load
245–260 kPa · mode 1
Atmospheric correction fa · fuel factor fm
0.979 · 1.000
0.977 · 1.000
Required accuracy
Permissible deviation
Engine speed
± 2% of reading or ± 1% of maximum
Torque
± 2% of reading or ± 1% of maximum
Fuel consumption
± 2% of the engine's maximum value
Gaseous emissions
± 2% of full scale, per analyser range
Particulates
± 5% of reading, gravimetric
Source GBT104002131 §2.3, §2.6, §2.8, PDF p.7, 8, 10 · GBT104002132 §2.3, §2.6, §2.8, PDF p.7, 8, 10
04 · Fuel
The laboratory finds no measurable change in the fuel's standard parameters; on the road diesel, the cetane number rises from 52 to 56.
The gain does not come from a more energetic fuel batch: the same batch, its calorific value certified before testing (ISO 1928), serves all four campaigns. After treatment, the laboratory's conclusion on eleven analyses is no measurable change; calorific value is not among them.
Certificate of analysis
Method
Road diesel · EN 590
Marine · DMB
Density at 15 °C
ISO 3675
835.4 kg/m³
875.0 kg/m³
Kinematic viscosity at 40 °C
ISO 3104
3.18 mm²/s
9.8 mm²/s
Sulphur
ISO 20846 · ISO 8754
8.2 mg/kg
1.80% m/m
Flash point
ISO 2719
62 °C
62 °C
Lower calorific value
ISO 1928
42,700 kJ/kg
42,200 kJ/kg
Water
ISO 12937 · ISO 3733
52 mg/kg
0.10% v/v
Carbon residue
ISO 10370
0.18% m/m · on the 10% distillation residue
0.28% m/m · micro method
Ash
ISO 6245
< 0.01% m/m
< 0.01% m/m
Vanadium
ISO 14597
—
< 2 mg/kg
Cetane number
ISO 5165
52.4
—
Cetane index
ISO 4264
51.8
43.5
Distillation, T95
ISO 3405
348 °C
—
Certificate reference
—
FA-2024-02915
FA-2024-03187
Source GBT104002131 §3.2, PDF p.12 · GBT104002132 §3.2, PDF p.11. Analysed by an accredited laboratory before testing. Certificates available on request.
Eleven analyses before and after. The laboratory's conclusion: no measurable change.
Laboratory conclusion, section 7 of both reports: comparative testing did not reveal any measurable change in standard physicochemical parameters within the detection limits of the analytical methods applied.
Density at 15 °CISO 3675 · hydrometer
Kinematic viscosity at 40 °CISO 3104 · capillary tube
SulphurISO 8754 · X-ray fluorescence
Flash pointISO 2719 · Pensky-Martens closed cup
WaterISO 12937 · coulometric Karl Fischer
Carbon residueISO 10370 · micro method
AshISO 6245 · incineration
Cetane indexISO 4264 · four-variable formula
Acid numberISO 6619 · potentiometric titration
Molecular compositionASTM D2425 · GC-MS mass spectrometry
Infrared spectrumASTM E1252 · FTIR
Samples collected to ISO 3170: from the tank before treatment, and from the tank after treatment and two hours of circulation. Two 1,000 mL bottles each, amber glass, sealed, stored alike and analysed in the same batch by a CNAS/CMA accredited fuel laboratory. Acceptance criterion, appendix C.5: every difference within the repeatability limit r of its method. The reports give the analysis programme (appendix C.3) and the laboratory's conclusion (section 7), not a table of individual before-and-after values. That conclusion covers standard physicochemical parameters; auto-ignition behaviour is measured separately, on a variable-compression-ratio engine.
Source GBT104002131 appendices C.2-C.5, PDF p.21-22 · GBT104002132 appendices C.2-C.5, PDF p.19-20
Cetane: no measurable change in the index, a rise in the number.
Two quantities share the name. The cetane index, ISO 4264, is calculated from density and distillation: it is one of the eleven analyses covered by the laboratory's conclusion of no measurable change. The cetane number, ISO 5165, is measured on a CFR engine by ignition delay: it is the fuel's actual behaviour in a cylinder.
On the road diesel, the cetane number rises from 52 to 56. The CFR engine is first calibrated on reference fuels, cetane and alpha-methylnaphthalene. Each sample is then measured three times in a row and the result is the mean of the three; consecutive readings must stay within the repeatability limit r of ISO 5165. The change between untreated and treated fuel is expressed in whole points (appendix D.6). Treated fuel is drawn downstream of the catalyst at the engine inlet, sealed at once and measured within four hours.
Source GBT104002131 §3.2, PDF p.12; §5.3, PDF p.15; appendix D, PDF p.23-25
Octane does not apply to these two tests. The research and motor octane numbers, EN ISO 5164 and 5163, rate a petrol's resistance to knock. Both fuels here are diesels, whose ignition quality is expressed by cetane. Neither report contains an octane measurement.
05 · Record
Less fuel per kilowatt-hour, lower emissions of every species measured, more power at every load point.
Emissions are weighted means over the cycle, three samplings per condition. Consumption is the mean of two campaigns.
road diesel at 8.2 mg/kg S, not measured · 8.46 → 7.19 g/kWh
Power and torque
every load point · ± 1.5% and ± 1.0%, k = 2
Source GBT104002131 §4.1, §5.3, §6, PDF p.14-16 · GBT104002132 §4.1, §5.3, §6, PDF p.12-14
No treated value comes near its baseline uncertainty band.
Baseline set to 100. The bars around each point are the laboratory's expanded uncertainty at k = 2.
Baseline = 100With NTROPYX, % of baselineExpanded uncertainty, k = 2 · not stated for smoke number
Source GBT104002131 §4.1, §5.3, §6, PDF p.14-16 · GBT104002132 §4.1, §5.3, §6, PDF p.12-14
Absolute values, both engines, with the laboratory's uncertainty.
Show every value as a table
Scania DC13-114 · ESC · GBT104002131
Quantity
Unit
Baseline
NTROPYX
Change
U per reading, k = 2
Fuel consumption
g/kWh
210
178
−15.2%
± 2.0%
Nitrogen oxides
g/kWh
1.650
1.320
−20.0%
± 3.0%
Nitric oxide, NO
g/kWh
1.535
1.228
−20.0%
—
Nitrogen dioxide, NO₂
g/kWh
0.115
0.092
−20.0%
—
Carbon monoxide
g/kWh
0.500
0.276
−44.8%
± 3.0%
Hydrocarbons
g/kWh
0.150
0.053
−64.7%
± 5.0%
Particulates
g/kWh
0.014
0.0044
−68.6%
± 8.0%
Smoke number
BSN
0.60
0.11
−81.7%
—
Exhaust oxygen
%vol
10.8
7.4
−31.5%
± 1.0%
Power · torque
kW · Nm
—
every load point
+17.5%
± 1.5% · ± 1.0%
Caterpillar C32 ACERT · E3 · GBT104002132
Quantity
Unit
Baseline
NTROPYX
Change
U per reading, k = 2
Fuel consumption
g/kWh
235
200
−15.0%
± 2.0%
Sulphur oxides
g/kWh
8.46
7.19
−15.0%
± 4.0%
Nitrogen oxides
g/kWh
7.40
5.92
−20.0%
± 3.0%
Nitric oxide, NO
g/kWh
6.88
5.50
−20.1%
—
Nitrogen dioxide, NO₂
g/kWh
0.52
0.42
−19.2%
—
Carbon monoxide
g/kWh
0.650
0.358
−44.9%
± 3.0%
Hydrocarbons
g/kWh
0.350
0.123
−64.9%
± 5.0%
Particulates
g/kWh
0.035
0.011
−68.6%
± 8.0%
Smoke number
BSN
4.2
0.8
−81.0%
—
Exhaust oxygen
%vol
11.0
7.5
−31.8%
± 1.0%
Power · torque
kW · Nm
—
every E3 mode
+18.0%
± 1.5% · ± 1.0%
Source GBT104002131 §4.1, §5.3, §6, PDF p.14-16 · GBT104002132 §4.1, §5.3, §6, PDF p.12-14
Carbon dioxide falls by 15.0% on both engines. Each CO₂ reading carries an expanded uncertainty of ± 2.0% (k = 2). The uncertainty budgets are held by the laboratory: UB-2024-EBT02 for the road engine, UB-2024-EBT09 for the marine engine.
06 · Cross-checks
Both checks hold: power within 1.1 kW, sulphur oxides as the fuel's sulphur predicts.
A table of results is either consistent with itself or it is not. These two checks are NTROPYX's own calculations, made with the reports' numbers alone and, for sulphur, the mass ratio of SO₂ to sulphur, 1.998.
Power equals torque times speed.
P [kW] = 2π · n [min⁻¹] · T [N·m] / 60,000
Recomputed at the eight load points, baseline and treated, on both engines: sixteen values. The largest gap to the published power is 1.1 kW.
Point
n, min⁻¹
Torque, Nm
Published, kW
Recomputed, kW
Scania · A 100 %
1,105
2,200 / 2,585
254 / 298
254.6 / 299.1
Scania · B 100 %
1,430
1,769 / 2,079
265 / 311
264.9 / 311.3
Scania · C 100 %
1,755
1,442 / 1,694
265 / 311
265.0 / 311.3
Scania · Rated
1,900
1,332 / 1,565
265 / 311
265.0 / 311.4
Caterpillar · Mode 1
1,800
4,721 / 5,571
890 / 1,050
889.9 / 1,050.1
Caterpillar · Mode 2
1,638
3,894 / 4,596
668 / 788
667.9 / 788.4
Caterpillar · Mode 3
1,440
2,951 / 3,482
445 / 525
445.0 / 525.1
Caterpillar · Mode 4
1,134
1,878 / 2,216
223 / 263
223.0 / 263.2
Each cell reads baseline / NTROPYX.
Sulphur oxides follow the fuel burnt.
SO₂ = fuel × 1.80% S × 1.998
If all the sulphur leaves as SO₂, each gram gives 1.998 g of it. At 235, then 200 g of fuel per kWh, the marine fuel should give 8.45, then 7.19 g/kWh. The UV-fluorescence analyser read 8.46, then 7.19.
The analyser's reading matches the sulphur in the fuel burnt to within 0.01 g/kWh, and falls by 15.0%, which the laboratory describes as in proportion to the fuel consumption decrease. The reports do not state how exhaust mass flow was determined, so this agreement alone does not show that the reading is independent of the fuel weighing.
Source Computed by this page from GBT104002131 §5.1-5.2, PDF p.15 · GBT104002132 §5.1-5.2, PDF p.13; sulphur: GBT104002132 §3.2, PDF p.11, §4.1, PDF p.12, §5.3, PDF p.13
07 · Compliance
Where these values sit against regulatory ceilings.
The laboratory records both engines as compliant before treatment, in section 4.2 of both reports. What the catalyst changes is the distance to each ceiling.
Euro V · China V
Directive 2005/55/EC · GB 17691-2005 — Scania
Nitrogen oxideslimit 2.000 g/kWh
Particulateslimit 0.020 g/kWh
Carbon monoxidelimit 1.500 g/kWh
Hydrocarbonslimit 0.460 g/kWh
BaselineWith NTROPYXCeiling
Both configurations are fully compliant with Euro V · China V limits, in the laboratory's words (section 4.2).
IMO Tier II
MEPC.177(58) · GB 15097-2016 — Caterpillar
Nitrogen oxideslimit 7.8 g/kWh
BaselineWith NTROPYXCeiling
At 1,800 rpm the Tier II ceiling stands at 7.8 g/kWh. The baseline engine measures 7.40. With the catalyst, 5.92 — 25% below the ceiling, with no engine modification and no added after-treatment.
Source GBT104002131 §4.2, PDF p.14 · GBT104002132 §4.2, PDF p.13; shares of ceiling computed by this page
08 · Margin
How much of the regulatory ceiling stays consumed.
Each ceiling is a budget. The outer ring shows what the baseline engine consumes of it, the inner ring what it consumes with the catalyst. The less the ring is filled, the greater the margin.
of ceiling
Nitrogen oxides
Euro V · 2.000 g/kWh
16.5 points freed
of ceiling
Particulates
Euro V · 0.020 g/kWh
48.0 points freed
of ceiling
Carbon monoxide
Euro V · 1.500 g/kWh
14.9 points freed
of ceiling
Hydrocarbons
Euro V · 0.460 g/kWh
21.1 points freed
of ceiling
Nitrogen oxides
IMO Tier II · 7.8 g/kWh
18.9 points freed
Baseline engineWith NTROPYX · Scania, Caterpillar
Show the values as a table
Pollutant
Ceiling
Baseline
With NTROPYX
Margin freed
Nitrogen oxides · Euro V
2.000 g/kWh
1.650 · 82.5%
1.320 · 66.0%
16.5 pts
Particulates · Euro V
0.020 g/kWh
0.014 · 70.0%
0.0044 · 22.0%
48.0 pts
Carbon monoxide · Euro V
1.500 g/kWh
0.500 · 33.3%
0.276 · 18.4%
14.9 pts
Hydrocarbons · Euro V
0.460 g/kWh
0.150 · 32.6%
0.053 · 11.5%
21.1 pts
Nitrogen oxides · IMO Tier II
7.8 g/kWh
7.40 · 94.3%
5.92 · 75.4%
18.9 pts
Source GBT104002131 §4.2, PDF p.14 · GBT104002132 §4.2, PDF p.13; shares of ceiling computed by this page
09 · Efficiency
Power up 17.5% and 18.0%, exhaust 20 to 32 °C cooler under load: in the laboratory's reading, more of the fuel becomes work.
An engine producing more normally rejects more heat. Here, across the four load points, power gains 17.5% on average and temperature drops by up to 30 °C.
The laboratory reads this as the signature of better thermal efficiency: a larger share of the fuel's energy becomes mechanical work instead of heat. It also reports residual oxygen falling by 31.5%, which it describes as consistent with improved combustion efficiency.
The marine engine repeats the pattern over its four E3 modes: power +18.0% on average, exhaust 20 to 32 °C cooler.
Scania DC13 · four speeds at full loadCaterpillar C32 · four E3 modes
Scania DC13 · baseline → NTROPYX
Point
min⁻¹
Power, kW
Torque, Nm
Exhaust, °C
Idle
430
0
—
185 → 178
A · 100%
1,105
254 → 298
2,200 → 2,585
440 → 412
B · 100%
1,430
265 → 311
1,769 → 2,079
475 → 448
C · 100%
1,755
265 → 311
1,442 → 1,694
505 → 475
Rated
1,900
265 → 311
1,332 → 1,565
485 → 455
Caterpillar C32 · baseline → NTROPYX
E3 mode · weight
min⁻¹
Power, kW
Torque, Nm
Exhaust, °C
1 · 0.20
1,800
890 → 1,050
4,721 → 5,571
490 → 458
2 · 0.50
1,638
668 → 788
3,894 → 4,596
432 → 403
3 · 0.15
1,440
445 → 525
2,951 → 3,482
385 → 362
4 · 0.15
1,134
223 → 263
1,878 → 2,216
328 → 308
Source GBT104002131 §5.1-5.2, PDF p.15 · GBT104002132 §5.1-5.2, PDF p.13
10 · Electromagnetic fields
NTROPYX emits no field. Fields are what it must be kept from.
VIRGO GLOBAL ENERGY SA states that the product itself emits no electromagnetic field, and that exposure to electromagnetic fields can neutralise it. At the client's request, the laboratory monitored and controlled the electromagnetic background on both benches (appendices C.4 and E.4); its protocol notes that the product's effects are sensitive to the electromagnetic field environment (appendix D.4).
5m
Cetane engine (CFR)
Electric field below 1 V/m, magnetic field below 0.1 mT, or conductive screening deployed.
Appendix D.4
12m
Test engine
Surveyed with a Trifield 100XE meter before the first baseline run: no external electric field detected.
Section 2.2
15m
Engine and dynamometer
Absence of abnormal interference sources verified, background levels recorded.
Appendix E.4
Three set-ups, three centres, one scale: every radius is drawn on the same 0–15 m rule.
Six groups of isolation measures, identical in both reports.
Screening
Conductive foils and screeningto block and absorb any residual field · section 2.2; appendix D.4 for the cetane engine
Engine mounting
Electrically insulated rubber padsfull isolation from the ground system · section 2.2, appendix E.4 item 1
Driveshaft
Composite isolation couplingbetween engine and dynamometer; dynamometer on its own ground · section 2.2, appendix E.4 items 2 and 6
Fuel and coolant lines
Fuel in rubber or composite hosesnon-metallic; coolant lines on insulated mounting brackets · section 2.2, appendix E.4 items 3 and 4
Signals and cabling
Speed sent wirelesslytorque on shielded differential lines; shielded cabling grounded apart from the engine; consumption on a battery-powered balance · section 2.2, appendix E.4 item 5 and (c)
Fuel samples
Glass containerschemistry samples kept from transformers, high-voltage lines and high-power motors, analysed promptly (appendix C.4); cetane samples sealed at once and measured within 4 h (appendix D.4)
Source GBT104002131 §2.2, PDF p.7; appendices C.4, D.4 and E.4, PDF p.22, 24, 26 · GBT104002132 §2.2, PDF p.7; appendices C.4, D.4 and E.4, PDF p.20, 21, 24
These controls were applied identically to the baseline and the treated runs, so the comparison stays like for like. The report files them under Adaptation of Test Protocol: the protocol is based on the ESC and E3 cycles, with supplementary electromagnetic controls (section 2.7).
11 · Dilution
Both benches ran at 1 : 20,000, one of the three standard bottle ratios.
What the technology acts at, and what is actually supplied, are not the same number. The benches were dosed at 1 : 20,000, one of the three standard bottle ratios.
In its pure form, the technology acts below 0.02 ppm. It is not a working dose. What is supplied goes up to 1 : 500,000, and the standard bottles treat 10,000, 20,000 or 50,000 litres per litre of product. The two bench engines were dosed at 1 : 20,000. On a wide screen the marks sit on a logarithmic scale; on a narrow one they are listed in order.
Source Company statement (NTROPYX), not taken from the laboratory reports, except the 1 : 20,000 bench dosing (appendix B.2 of both reports).
12 · On board
On board M/V KAYRA, a comparative reading, not a laboratory one: 18.3% less fuel on two gensets.
M/V KAYRA, a Phinisi moored at Serangan, Bali, 15–18 and 23 March 2026. Two onboard gensets, then the main engine at sea. Read this section apart from the previous eleven: the method is comparative, not laboratory-grade.
less fuel
Fuel, two gensets
30 spires baseline · 12 h constant load
−23.3% and −13.3% taken apart
more speed
Speed at sea, GPS
7.00 → 8.23 kt · over ground, peak in the turn · 23 March 2026
Estimated through water 8.28 kt · +18.3%
Gensets taken apart
−23.3%−13.3%
genset 1 · genset 2 · 30 → 23 and 26 spires, 12 h constant load
Speed gain at sea
+1.28 kt
7.00 → 8.28 kt, estimated speed through water · GPS peak 8.23 kt
The gensets gave 18.3% less fuel, from 15 to 18 March. At sea on 23 March, the GPS read a peak of 8.23 knots over ground during the turn, against a 7.00-knot baseline: 17.6% more, a calculation by this page. The report estimates speed through water at 8.28 knots. Two independent quantities, measured on separate days.
VGE-FTR-2026-BALI-001
Two 42 kVA gensets
MarelliMotori MJL 200 SA4 · 400 V · 1,500 rpm
Baseline consumption
30 spires each
With NTROPYX
23 and 26 spires
Reduction
23.3% and 13.3%
Each run
12 h, constant load
VGE-FTR-2026-BALI-001
SEAMAN CH900
Main propulsion, marine V8 · 23 March 2026
Baseline, after reconditioning
7.00 kt
Estimated speed through water
8.28 kt
Gain
+1.28 kt
Peak GPS during the turn
8.23 kt
The method is comparative, not volumetric. Consumption was read on a sight glass, using the corrugation ridges as a linear unit. What one ridge is worth in litres depends on the tank geometry, which was not characterised.
The electrical load was held by equipment, not by instrument. The same air conditioning, refrigeration, lighting and ventilation ran throughout, without a kW meter. Day and night ambient temperature may have moved the air conditioning load.
One cycle, not a series. VIRGO GLOBAL ENERGY SA recommends extended measurement with calibrated fuel flow meters, to ISO 3046 or equivalent, before any definitive claim.
Company statement, not from the laboratory reports. Bench values are obtained under controlled conditions. In operation, NTROPYX reports an average of 8 to 12% on consumption, which accounts for real load profiles. Road deployments with customer fleets began in 2015 and have continued since. Across those deployments — loaded vehicles, mixed terrain, cold starts, stop-and-go duty — none has returned a fuel saving below 8%. That is the lowest figure recorded, not a guaranteed result: each fleet’s gain follows its own duty cycle.
Scope
The laboratory limits its results to the engines, fuel batches and catalyst batches tested.
Accreditation
CNAS L23122 · ILAC-MRA · CMA 202419120184
Laboratory competence
ISO/IEC 17025:2017
Test period
16 to 26 March 2026
Nature
Bench test, commissioned by NTROPYX / VIRGO GLOBAL ENERGY SA
Inspection type
Entrusted inspection, to the client's technical specification
Sample
Submitted by the client, received intact · 16 and 20 March 2026
Issued
26 March 2026 · signed by inspector, reviewer and approver
Laboratory conclusion
Qualified against the client's technical specification · all tested items meet the specified requirements
Expanded uncertainty
k = 2, approximately 95% confidence · ISO/IEC 17025 and GUM
Uncertainty by quantity: consumption ± 2.0%, power ± 1.5%, torque ± 1.0%, speed ± 0.5%, carbon monoxide ± 3.0%, carbon dioxide ± 2.0%, nitrogen oxides ± 3.0%, hydrocarbons ± 5.0%, exhaust oxygen ± 1.0%, sulphur oxides ± 4.0% (marine engine), particulates ± 8.0%. No uncertainty is stated for the smoke number, nor for NO and NO₂ separately. The accreditations cited are those of the issuing laboratory, not those of NTROPYX or VIRGO GLOBAL ENERGY SA. Beyond the engine, the fuel batch and the catalyst batch tested, the laboratory states that any extrapolation to other engines, fuels or operating conditions calls for professional engineering assessment, case by case (section 9.4).
The laboratory states its own limits. Testing was run by an independent third party, without intervention from the client or the manufacturer. Because of persistence effects in the fuel system, the sequence runs one way, baseline then treated, with no return to baseline. The technology statement in appendix A was supplied by the client and lies outside the accredited scope.
References
Test reports
GBT104002131 · GBT104002132
Laboratory document
GDBT-B-20-F03, version B/0
Fuel certificates
FA-2024-02915 · FA-2024-03187
Uncertainty budgets
UB-2024-EBT02 · UB-2024-EBT09
Catalyst batches
NTX-QC-2024-0038 · NTX-QC-2024-0042
Available on request
Raw measurement logs, all modes, baseline and catalyst · fuel analysis certificates · instrument calibration certificates · uncertainty budgets